


Intro
We are currently experiencing a market environment showered with many different conflicting signals. Oil prices and the bond market are telling us we are screwed with inflation with rate hikes imminent yet company earnings are growing at massive rates quarter over quarter with demand in the entire AI trade not only holding but ACCELERATING further.
But which factors hold more weight? Although no one has a crystal ball and knows for sure what might happen in this article we will lay out all the major catalysts for this trading week and the next as well as give you dealer positioning and how the market is currently predicting the next two weeks.
Upcoming Catalysts
We have a huge two trading weeks incoming with massive catalysts that can completely shock the market in either direction. Lets start with exploring what is happening and give some insight into how it can effect the markets trajectory…
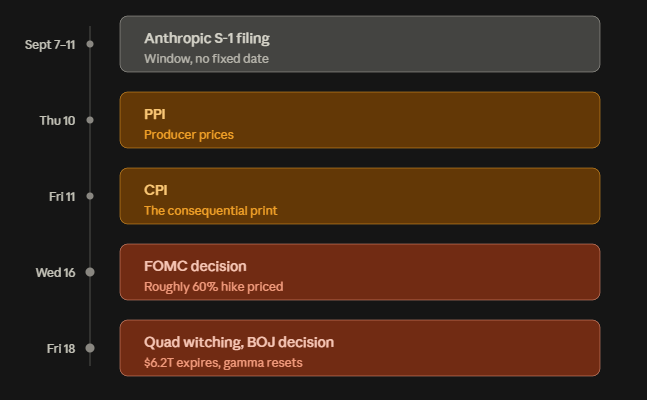
1) Anthropic Public S-1 Filing - (Expected this week of Sept 7-11)
Anthropic is reportedly expected to make public “shortly after labor day” their S-1 filing for their upcoming IPO targeted for late September/October. This will give the world clear insight into the companies financial statements including earnings, growth rates, and asset/liabilities.
We expect Anthropic to release great numbers in their S-1 Filing which will solidify demand for AI hardware into next year at the minimum. Expect names like Nvidia, Broadcom, AMD e.t.c to react positively to good news from anthropic.
Once again though this report is unconfirmed by Anthropic themselves so take it as a possibility not fact.
2) PPI/CPI (Thursday Sept 10 / Friday Sept 11)
The massive inflation data is dropping this week and will be very telling of what we could expect in the FOMC meeting the following week, if inflation comes in hotter than expected that strengthens the case for a rate hike when the market is already pricing in odds of a rate hike at 60%. This will rock the market as the entire AI trade relies on cheap debt for sustaining the hyper growth phase we are in. Expect a meaningful market drop if inflation comes in hot and a much stronger fall if rates are increased as well.
If inflation data comes in cool that would be amazing for the AI sector as it will decrease the odds of a September rate hike forcing the market to reprice the AI names that rely on cheap debt to continue growing.
If the data is right on target it just puts all the weight on the FOMC meeting to see what really will be the outcome, although we STRONGLY believe we are maintaining rates as it would be stupid in our view to hike rates due to inflation caused by a oil supply shock that may not even be a factor by the time the heightened rates actually impact the economy in 12-18 months.
3) The FOMC Decision (Wednesday Sept 16)
Now for the biggest catalyst of them all, the rate decision. We have maintained that the rates will be maintained steady as current inflation is due to the oil supply shock and not true structural inflation and that Warsh would be crazy to preemptively hike rates only to combat a shock. We also know Warsh likes to play it slow with his heavy data driven mindset and use of his “task forces” its clear he does not want to jump the gun early so to speak.
However we still see the market pricing in a 60% chance of a hike next week with bond yields rising higher and higher in anticipation. Now lets breakdown what could occur given a hike scenario vs a maintained rate scenario…
IF RATES ARE INCREASED: all of the AI names that rely on heavy debt raising will get killed, because if you take a business that already has compressed margins from debt/depreciation then you make their future debt even more costly to further compress margins and earnings wall street does not like that very much.
In fact we can see the market currently rotating money away from the names that are most debt reliant and into the names with strong cash flows NOW as a hedge against the potential rate hike. Today we saw the mag 7 fall and names like AMD, NBIS rise 5%, 8% respectively. The MAG 7 funding the AI companies do so by raising debt so they get hit the hardest from increased cost of debt. This could even at the worst turn into a cascading event where increased cost of debt slows future capex commitments therefore taking the whole of the AI hardware industry down with it. Overall a very grim outcome.
IF RATES ARE MAINTAINED: The market pricing in high odds of a rate hike give traders a great opportunity if they believe rates will remain steady. If the rates are held firm then fear around the entire AI sector will soften dramatically leading into what we believe will be the hardware rally 2.0. Everyone wins as the market will have to reprice these names now that the hike fear is off the table.
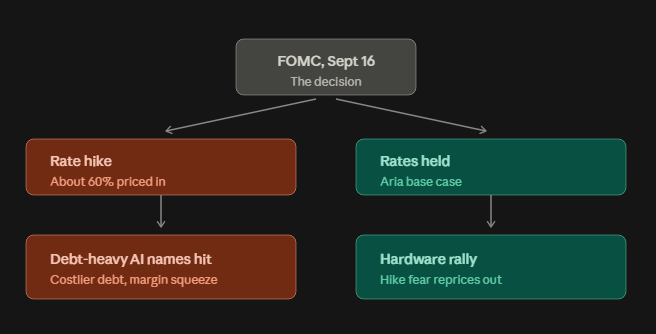
This is the outcome we believe will occur and we think the market is truly mispricing the odds of each outcome stated above, thus giving us an opportunity to capitalize on said mispricing. We are playing these two weeks very carefully and will touch on our personal strategies further below.
Market Positioning
Now that we know the catalysts occurring lets break down how the market is positioned for the next two chaotic weeks ahead.
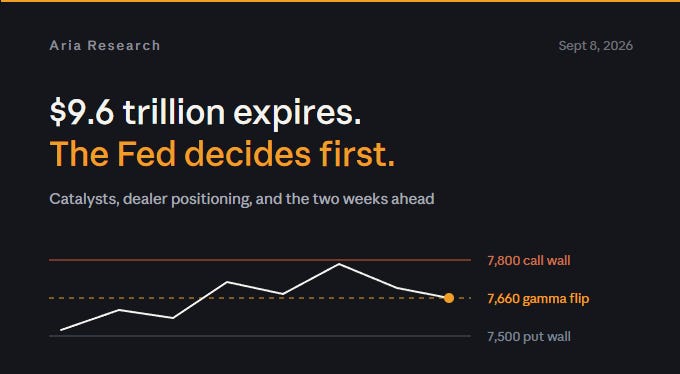
Citadel Securities reported on Aug 31st that $9.6 trillion (about 35% of total US options exposure) expire before Sept 18. A daunting headline that has your talking heads on X, YouTube etc all claiming this will lead to a “cataclysmic event”. In reality this figure is not that daunting at all, we have seen month after month massive concentrations of options exposure falling on small timeframes exactly like we see for the window of Aug 31-Sept 18. Like in June where we had $7.7 trillion expiring in a compressed window as well. What happened? Nothing extraordinary, market was actually pretty flat because it is the details that matter and knowing dealer positioning is the most valuable takeaway from options analysis. So lets do just that and break into how the market is currently positioned…
We see on QQQ options expiring on the 18th we have a put/call ratio of 1.43. A strong ratio favoring puts but we cannot tell if this is true speculation of a market fall or just hedging by those with long positions, still important to look at and reiterating the fact that a market shock where rates are maintained can truly be the start of the next big rally as fear can erode rapidly.
As of Sept 4th we see that for the SPX (S&P 500) there exists a massive call wall at 7800, a put wall at 7500 with a zero gamma flip at 7660. With SPX closing today on Tuesday Sept 8 at 7673 what do these numbers actually tell us and how does it help us in our own trades?
We’ll start with the zero gamma flip as it is the most important of the 3 values to understand. What this is modelling is the price of SPX where dealers gamma exposure flips from net short gamma below 7660 to net long gamma above 7660. But now what the heck does that mean??
When dealers are net short gamma it means these dealers in order to hedge their positions to stay neutral directionally MUST sell shares of a stock as the stock declines and buy shares as the stock increases. This in practical senses AMPLIFIES moves both positive and negative as all of these dealers are forced to sell low and buy high which in turn pushes the stock lower or higher more aggressively.
Above 7660 this inverses where in order to stay neutral these dealers must sell shares as the stock increases and buy shares as the stock decreases. This makes big breakout moves in either direction much more difficult as the dealers are actively countering the markets movements.
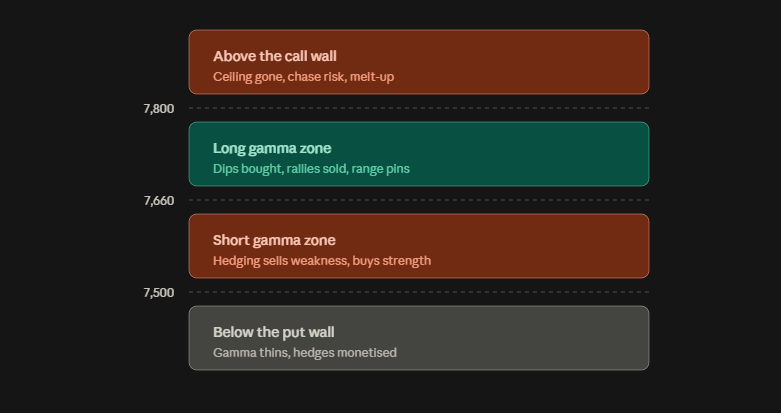
Now the call and put walls. They act as natural forced support and resistance, if the price of SPX is approaching 7800 since we are in a net dealer long gamma zone as explained before it makes it harder for big rallies or big dips to occur and the closer to 7800 you get the more selling of stock occurs as delta increases faster the closer to the money. This is why the 7800 level will act as a natural resistance.
Above the call wall you actually get amplification on the upside. But not because dealers flipped short gamma. It’s because the dealers no longer need to sell shares as aggressively to stay delta neutral. So the entire “resistance force” becomes dramatically weaker and any new call buying above the call wall level creates dealer short call exposure that MUST be hedged by you guessed it, BUYING MORE SHARES!
The put wall works in a similar but not as concrete way, as it falls below 7660 moves are accelerated to the downside/upside. If the market keeps falling and falling toward the 7500 level that’s where dealer short gamma is the HIGHEST thus the moves are the most amplified. However once it passes through 7500 gamma decreases which slows down the amplification of market moves whilst simultaneously allowing dealers to “unwind their hedges” by buying back stock which is why the put wall acts as a natural support level.
Below 7500 dealer hedging becomes a non factor on market moves and price action becomes much more reliant on true supply vs demand mechanics.
IMPORTANT INFO ON CALL/PUT WALLS:
All of these values stated here not fixed in time and are constantly evolving on a daily basis due to changes in open interest and volumes at different strikes on the options chain. A call wall acts as resistance a lot stronger than a put wall acts as support just due to the put wall having the amplified moves from short dealer gamma allowing price to blow straight through that floor with ease and call walls having true forced selling of stock as it approaches the price acting as a reliable resistance level.
The best way to determine if a breakout can occur through a call wall is Call Wall Repositioning. If a call wall relocates overnight in a model to 7850 instead of 7800 the prior day that gives you a lot more confidence in price having a stronger ability to breakout past 7800 as the call wall has weakened substantially.
All this dealer positioning is never known as fact. This is all inferred data from open interest and volumes at certain strikes. Open Interest only tells you the contract exists out there, it does not tell you which side the dealer holds.
So these values are just modelled and are “best estimations” rather than being true concrete fact and anyone who tells you otherwise just has no clue what they are talking about or are extremely overconfident in their abilities.
